Measures of Position: Outliers*
A data set should be checked for extremely high or extremely low values. These values are called outliers.

An outlier can strongly affect the mean and standard deviation of a variable. For example, suppose a researcher mistakenly recorded an extremely high data variable. This value would then make the mean and the standard deviation of the variable much larger than they really were.
Since these measures (mean and standard deviation) are affected by outliers, they are called nonresistant statistics. The median and interquartile range are less affected by outliers, so they are called resistant statistics. Sometimes when a distribution is skewed or contains outliers, the median and interquartile range can be used to more accurately describe the data than the mean and the standard deviation. Outliers can have an effect on other statistics as well. There are several ways to check a data set for outliers. One method is shown in this Procedure Table.
Since these measures (mean and standard deviation) are affected by outliers, they are called nonresistant statistics. The median and interquartile range are less affected by outliers, so they are called resistant statistics. Sometimes when a distribution is skewed or contains outliers, the median and interquartile range can be used to more accurately describe the data than the mean and the standard deviation. Outliers can have an effect on other statistics as well. There are several ways to check a data set for outliers. One method is shown in this Procedure Table.
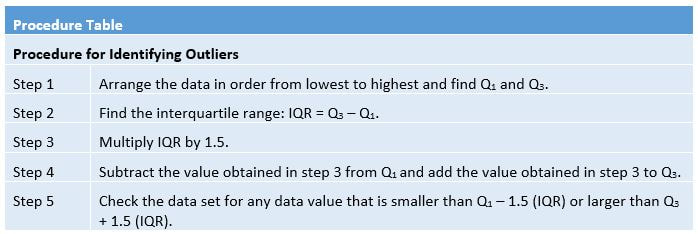
This procedure is shown in Example 3-36.
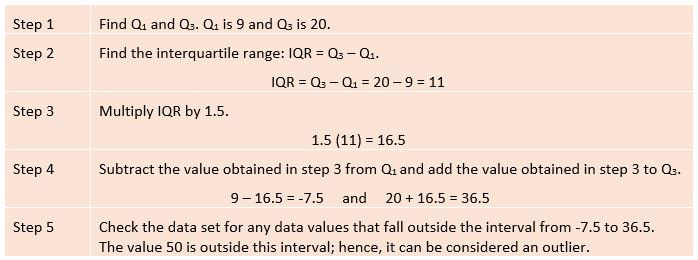
EXAMPLE 3-36 Outliers
Check the following data set for outliers.
5, 6, 12, 13, 15, 18, 22, 50
SOLUTION: The data value 50 is extremely suspect. These are the steps in checking for an outlier.
EXAMPLE 3-36 Outliers
Check the following data set for outliers.
5, 6, 12, 13, 15, 18, 22, 50
SOLUTION: The data value 50 is extremely suspect. These are the steps in checking for an outlier.
There are several reasons why outliers may occur. First, the data value may have resulted from a measurement or observational error. Perhaps the researcher measured the variable incorrectly. Second, the data value may have resulted from a recording error. That is, it may have been written or typed incorrectly. Third, the data value may have been obtained from a subject that is not in the defined population. For example, suppose test scores were obtained from a seventh-grade class, but a student in that class was actually in the sixth grade and had special permission to attend the class. This student might have scored extremely low on that particular exam on that day. Fourth, the data value might be a legitimate value that occurred by chance (although the probability is extremely small).
There are no hard-and-fast rules on what to do with outliers, nor is there complete agreement among statisticians on ways to identify them. Obviously, if they occurred as a result of an error, an attempt should be made to correct the error or else the data value should be omitted entirely. When they occur naturally by chance, the statistician must make a decision about whether to include them in the data set.
When a distribution is normal or bell shaped, data values that are beyond 3 standard deviations of the mean can be considered outliers.
* Bluman, Allan G. Elementary Statistics: Step by Step Approach. McGraw-Hill, 2014.
This text has 27 sentences, with 420 words (15.56 per sentence) with 1.63 syllables per word.
Flesch-Kincaid Grade Level 9.7
This text has 27 sentences, with 420 words (15.56 per sentence) with 1.63 syllables per word.
Flesch-Kincaid Grade Level 9.7
Comprehension and Reading Skills Quiz
If taking the online version of this quiz, please click through using the button below. It will automatically score itself when you finish. If you miss two or more questions, you should consider taking a Reading Skills lab to enhance your reading and study skills proficiency.